guest@mda ~ $ cat blog/monitoreo-y-seguridad-en-aws.en.md
Alerting on symptoms: a monitoring and security design for AWS
A reference design using common tools; internal details of any employer are omitted.
Most monitoring setups fail from excess: plenty of data and alerts nobody reads. The thesis of this note is that a small team operating on AWS should alert only on symptoms users feel and send everything else to a dashboard.
The signals I would look at first
The classic operations signals are latency, traffic, errors and saturation. I would add security as a fifth, handled separately because it has a different rhythm and different recipients.
Latency is how long the service takes to respond, and traffic is how much demand it receives. Errors measure what share of requests fail. Saturation shows how close a resource is to running out, such as database connections or disk. With those four you can tell whether the service is healthy without knowing each component's internals.
Metrics, logs and security findings kept apart
Prometheus scrapes the metrics, Mimir stores them long term and Loki holds the logs, with Grafana querying all of it in one place. Prometheus and Loki share a label model, which makes it easy to jump from a graph to the logs of that same moment.
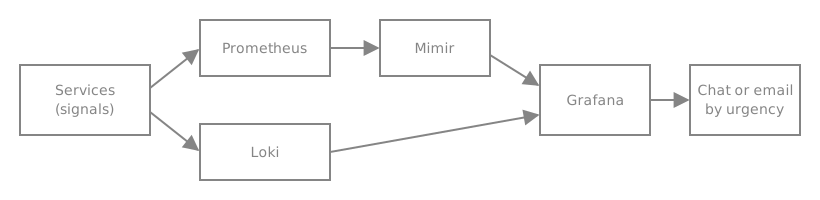 Reference design: from signal to alert.
Security findings stay out of this loop. They are discrete events with a severity and an owner, not time series, and they belong somewhere you can track the state of each one.
Alerting on symptoms
An alert should map to something a user already notices or is about to: the external health check fails, the error rate stays elevated, or a resource nears its limit. An illustrative Prometheus rule, with a threshold and window that would need calibrating against real data:
# Illustrative: the values are examples
- alert: HighErrorRate
  expr: |
    sum(rate(http_requests_total{status=~"5.."}[5m]))
      / sum(rate(http_requests_total[5m])) > 0.05
  for: 10m
  labels:
    severity: page
A more mature step is SLO-based alerting with burn rate: instead of a fixed threshold, you measure how fast the error budget is being consumed and alert when the pace, over both a short and a long window, threatens to exhaust it.
I would not alert on CPU itself, since it fluctuates constantly and rarely means anything. Saturation, however, is a real signal: alert only when a resource is genuinely approaching its limit, such as a disk at 90% or a nearly exhausted connection pool. Every alert that leads to no action teaches the team to ignore alerts, and that habit spreads to the ones that matter.
Channels depend on urgency. Sustained errors are an incident and should go through a fast channel, such as chat or an on-call system. Email is for anything non-urgent: early warnings, summaries and whatever can wait until morning.
Security Hub aggregates and is not in the traffic path
Security Hub does not see traffic. It aggregates findings from other services, and that difference matters when drawing the design.
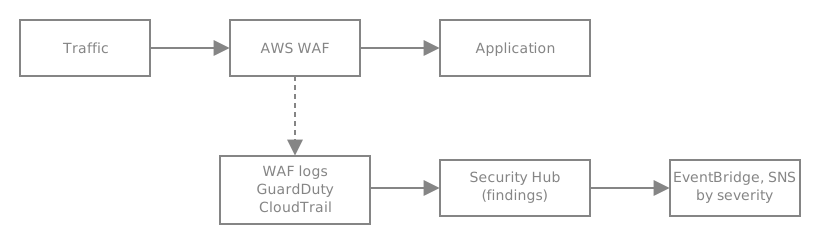 Traffic takes one path and findings take another.
With Organizations, the sensible move is to collect findings from every account into a security account. As a reference design, findings flow to Amazon EventBridge, a rule filters for high or critical severity and publishes to an SNS topic, which delivers the notification to the owner of the affected resource instead of a general list. The rest stays in the console with a scheduled periodic review.
The WAF as a signal source
A WAF is more than a blocker. Logs of which rules fire, from where and how often show what is being tried against the application. An unusual jump in one rule is a useful signal even when all that traffic was blocked.
New rules are best placed in count mode first, reviewed for what they would trigger, and only then switched to block. A strict rule that cuts legitimate traffic tends to be discovered when someone complains, which is a bad moment to find out.
What I would leave out at first
Per-user or per-request metrics, and anything with high-cardinality labels: it is the most expensive thing to store and query, and it is rarely needed on day one. I would also skip a dashboard per component and alerts on metrics nobody knows how to read. If you cannot say what you would do on receiving the alert, it is not an alert.
Risks and limits
The design has seams. Alert fatigue returns even from a good start, because rules accumulate; a periodic review is needed to delete those that never led to an action. A notification chain with no backup can fail silently, so it should be tested end to end. A failure that leaves no trace in a health check or in the logs is invisible to all of this. Label costs can blow up if cardinality is not controlled from the start. And Security Hub findings can be numerous with very different urgency: triaging them is what gets neglected most.
Where to start small
One external health check and one error-rate alert. Prometheus and Grafana with a couple of dashboards for the four signals. GuardDuty and CloudTrail enabled, Security Hub aggregating, and a notification for high severity. The WAF in count mode with its logs visible.
After a month, review which alerts fired and which were useful, and adjust from there. Fixing a small design with data costs less than defending a large one without it.